Will Joe Biden be a good President, and why?
Compare versions Back to question
-
Study the background information carefully.
-
Read the background information carefully, before proceeding.
Wiki article
EditBackground
For objectivity, this question will be judged by Trump's approval rating after his 1st term, compared to that all prior presidents' since 1945. So, you must focus on Trumps full four year term. As always, please read the judgement rule § carefully before doing your trade or posting your argument.
Here is Trump's latest weekly approval rating according to Gallup and here is a composite approval rating as combined by FiveThirtyEight.
Indicator of Presidential Quality
FivethirtyEight, Nate Silver (Agreed Judgement Source)
Nate Silver modelled a combined presidential approval rating from several research institutes, intending to eliminate partisan bias.
| Rank | President | Start | 538 1st Term |
| 1 | Dwight Eisenhower | 1953 | 78.1 |
| 2 | Ronald Reagan | 1981 | 62.0 |
| 3 | Bill Clinton | 1993 | 58.8 |
| 4 | John Kennedy | 1961 | 58.2 |
| 5 | Harry Truman | 1945 | 57.2 |
| 6 | George H.W. Bush | 1989 | 54.7 |
| 7 | Richard Nixon | 1969 | 51.7 |
| 8 | Gerald Ford | 1974 | 51.5 |
| 9 | Barack Obama | 2009 | 51.4 |
| 10 | George W. Bush | 2001 | 50.1 |
| 11 | Lyndon Johnson | 1963 | 42.1 |
| 12 | Jimmy Carter | 1977 | 33.7 |
Source: 538
Since the Prediki community voted 93% for a judgement rule change from Gallup to a combined source, Trump's 538 1st term approval rating will result in the following verbal ratings:
- Very good: 58,8% or more
- Good: 54.7% to 58.7%
- Average: 51.8% to 54.6%
- Bad: 50.2% to 51.7%
- Very bad: 50.1% or less
Gallup (obsolete judgment source)
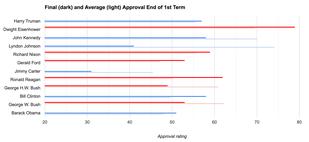
The most accessible indicator of a presidential standing for the 12 U.S. presidents since 1953 is Gallup's bi-weekly approval/disapproval survey. [1] The table below shows the last approval rating for each president at the end of his first term (for Lyndon Johnson after 1400 days in office).
Table: Presidential Approval Score At the End of Their First Term (Sorted)
| Rank | President | Start | Gallup 1st Term |
Final Approval |
Full presidency average |
|---|---|---|---|---|---|
| 1 | Dwight Eisenhower | 1953 | 79 | 59 | 70 |
| 2 | Ronald Reagan | 1981 | 62 | 57 | 50 |
| 3 | Richard Nixon | 1969 | 59 | 24 | 56 |
| 4 | John Kennedy | 1961 | 58 | 58 | 70 |
| 5 | Bill Clinton | 1993 | 58 | 65 | 50 |
| 6 | Harry Truman | 1945 | 57 | 32 | 56 |
| 7 | George W. Bush | 2001 | 53 | 29 | 62 |
| 8 | Gerald Ford | 1974 | 53 | 53 | 47 |
| 9 | Barack Obama | 2009 | 51 | 59 | 48 |
| 10 | George H.W. Bush | 1989 | 49 | 49 | 61 |
| 11 | Lyndon Johnson | 1963 | 41 | 43 | 74 |
| 12 | Jimmy Carter | 1977 | 31 | 34 | 46 |
Source: Gallup
The re-election campaign gives most incumbent presidents some uplift around the end of the first term. Gallup's time series chart is recommended reading to understand these dynamics. [2]
According to the data above, the following Gallup approval ratings were the original source:
- Very good: 58% or more
- Good: 57%
- Average: 54 to 56%
- Bad: 50 to 53%
- Very bad: 49% or less
Chart
 |
External sources
- Gallup: Presidential Approval Ratings
- Gallup: Presidential Job Approval Center
- FiveThirtyEight: How (un)popular is Donald Trump?
